I'm aware of Horizons 2 but I need some sort of proof of the other birds you mentioned. I will gladly make the changes if they are necessary.
I like the new Satbeams Beta. You can drill down to lots of details for each satellite.
SatBeams - Home

I'm aware of Horizons 2 but I need some sort of proof of the other birds you mentioned. I will gladly make the changes if they are necessary.
I like the new Satbeams Beta. You can drill down to lots of details for each satellite.
SatBeams - Home
")
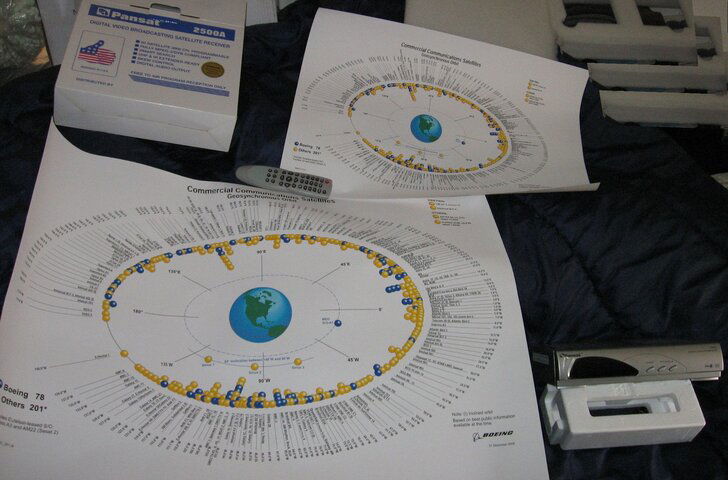
Your chart suggests otherwise
May I be so bold to ask what constitutes proof? The changes suggested seem to be general knowledge.
And, one concern: I might be stupid here, but, I am having trouble figuring out the vertical scale. Is there any meaning? It sort of looks like three levels, small satellites at the top, mixed in the middle, and large satellites at the bottom.. but I find no common attributes among the satellites depicted in those levels. Perhaps it was a matter of convenience in creating the picture?
129 isnt Echo 5....thats at 148 right now
Ciel II is at 129 for DBS
Echo 2 is dead...blew up a year or so ago
Echo 1 is on the move right now to 77 or 72ish I forget
Would you happen to know which frequency those run on (Ku, C or Both)?
Dude, why don't you try putting the info in the following post to some use?
http://www.satelliteguys.us/free-air-fta-discussion/180076-satellite-chart-pic.html#post1878369
List of satellites by orbital location and links to transponder lists
While technically correct, putting two birds at the same orbital location will complicate the visual design. IMHO.
here's another chart' if the dl worked and if you you can zoom in. iI have it adobe reader and can zoom and read each sat.
So do you now see the trouble I'm having. I've been shown 4 different charts and I'm unsure which ones are out of date and which ones are good.
None of the charts are 100% accurate, even with respect to what sats are active on what bands. I know of one CONUS satellite which is not shown correctly, with respect to what bands it has, on ANY of the popular satellite charts. Lyngsat is probably the most accurate chart out there. Personally, while I admire the effort, I think trying to make a chart to compete with Lyngsat is re-inventing the wheel and starting by making it square.
please correct me if I'm wrong, but isn't your chart backwards?
Brasilsat at 65 W would be over Brazil, not over Alaska.
Maybe I'm not looking at it properly. If that's the case, just ignore me ;-)
http://www.boeing.com/defense-space/space/bss/launch/980031_001.pdf

please correct me if I'm wrong, but isn't your chart backwards?
Brasilsat at 65 W would be over Brazil, not over Alaska.
Maybe I'm not looking at it properly. If that's the case, just ignore me ;-)
http://www.boeing.com/defense-space/space/bss/launch/980031_001.pdf
Hey, THANKS for posting that link.
That PDF really looks cool when printed on a large format printer...:up
")