 Has anyone else noticed that the signal strength on A&E HD - TP 27 on 129 is among the lowest on 129. I can barely pull in 50, while TP's 30 & 32 seem to be 75 & above. TP's 7 & 11 are in the upper 60's. But A&E is bar far the worst reception of the HD Channels.
A&E HD - Low Signal - TP27 on 129
- Thread starter rgregl
- Start date
- Latest activity Latest activity:
- Replies 56
- Views 8K
You are using an out of date browser. It may not display this or other websites correctly.
You should upgrade or use an alternative browser.
You should upgrade or use an alternative browser.
I can get reception from ALL transponders on 129 fine with the exception being transponder 27. I can't pull in Universal HD or A&E, I don't have Cinemax so that doesn't matter.
Same problem here - was the same with Live Earth yesterday too - signal strength on TP 27 is going anywhere between 45 and 65 depending on when you look at it.
Am getting frustrated with it now .. will have to make the call today to get them to come out and do something about it.
")
Am getting frustrated with it now .. will have to make the call today to get them to come out and do something about it.
Don't let them try to charge you to come out.
Even if you have the DHPP they will try to charge you $29.99
I have a guy scheduled for Sat. 7-21-07 Until then they gave me a $20.00 credit on my bill.
This problem is on THEIR end not yours, however, I am told that if they tweak the angles on the Dish, it MIGHT help.
Even if you have the DHPP they will try to charge you $29.99
I have a guy scheduled for Sat. 7-21-07 Until then they gave me a $20.00 credit on my bill.
This problem is on THEIR end not yours, however, I am told that if they tweak the angles on the Dish, it MIGHT help.

I've been having the same issues. Does anyone know what is going on? Will repointing the dish help? How do you get Dish to do it without charging you?
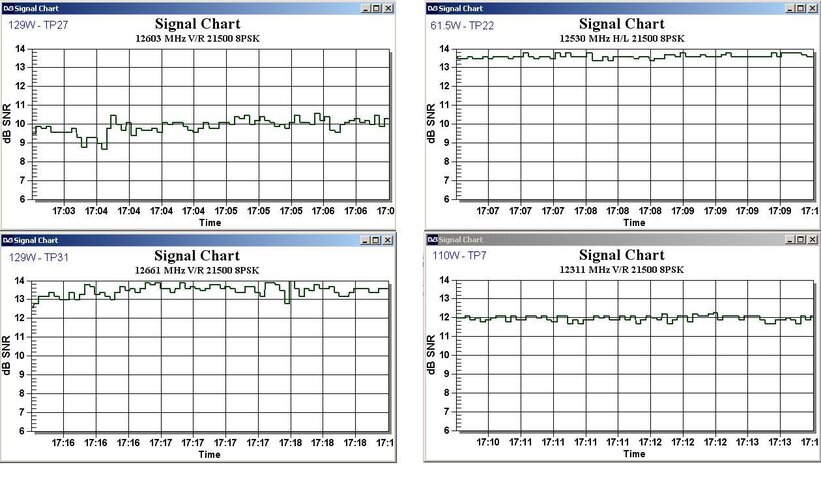
The bird at 129W is on its last legs... The signal level varies much more on it than any of the other birds they have up. I took the following signal measurements from 129W, 110W, and 61.5W using a D1000 for 110/119/129 and a D500 for 61.5W.
Notice how the signal goes up and down much more on the 129W transponders. The two graphs on the left are from 129W. The upper one is TP27. Much lower than TP . These are ploting signal strength in dB, so every 3dB drop is actually half the signal power (dB is in a log scale). TP31 is about 3dB higher than 27. TP31 on 129 varies more than 1dB in a 3 minute window, while TP27 varies almost 2dB! This is something that is uncorrectable on our end (unless you get a bigger dish to bump the signal level higher).
Compare that to the plots from 110W and 61.5W where I got at most 0.5dB variance over the same time period. This is what all of the TPs should look like. Currently I have little to no wind and not a cloud in the sky. I should not be seeing just large swings in the signal level on 129W if it was healthy. I have my D1000 peaked for 129, so thats why my 110W level is a tad low.
Edit to add:
Basic reading of graphs: Higher dB SNR is better and you want to see a nice straight line across, in optimal conditions.
Attachments
I posted recently more graphs with short and long runs plotting signal level from 129W tp27 using 1m dish here A&E HD T/P 27 won't stay on - DBSTalk.Com
 15 min
 30 min
 1hr
1hr
 8 hr
8 hr
 24 hr
24 hr
Conclusion: using bigger dish and proper alignment allow you keep the SS variation in 1-1.5 dB range, i.e. your receiver will not 'choke'.
Conclusion: using bigger dish and proper alignment allow you keep the SS variation in 1-1.5 dB range, i.e. your receiver will not 'choke'.
Ive got a D500 on 129 and during a storm today I lost 27 completely. Most of the other 129 Tp's were in the 60's still. TP27 seems almost worthless.
The dish 1000.2 is no real help for 129 either. I have drop outs on transponder27 all day long. IT looks like I will rehook up my 61.5 sat dish and cover the 129 lnb again. You would think Dish would of made better plans for this sat since they depend on HD to differentiate them from competitors. I guess by next year in the spring we can all swing our dishes, GOD willing no change in lnbs, and get the dish service in full mpeg 4. Then I won't ever have to worry again about 129 .
Ok, having lots of problems with the premium HD channels; sometimes audio, but no video, sometimes nothing. We are having serious haze problems today from forest fires. Any chance that the haze and particles of smoke in the sky are making this worse and impacting reception?
Send Email to Charlie
How about an email campaign to Charlie and complain about the problem with TP 27?
His email is: CEO@Echostar.com
I also included dishquality@echostar.com
I had to delete the timers I had for TP 27 because it was causing my ViP622 to lock up due to the low SS and distortion. My wife wanted to re-watch the Northern Exposure series, but we had to stop.
Write to Charlie and complain!!
That's not Charlie's email.How about an email campaign to Charlie and complain about the problem with TP 27?
His email is: CEO@Echostar.com
The dish 1000.2 is no real help for 129 either. I have drop outs on transponder27 all day long. IT looks like I will rehook up my 61.5 sat dish and cover the 129 lnb again. You would think Dish would of made better plans for this sat since they depend on HD to differentiate them from competitors. I guess by next year in the spring we can all swing our dishes, GOD willing no change in lnbs, and get the dish service in full mpeg 4. Then I won't ever have to worry again about 129 .
It helped here in my area. The tech came the other day trying to repeak my 1000. COuldn't get it any better, so he yanked it and put up a 1000.2. Everything increased slightly except T27. It increased by 20-25.
S~
That's not Charlie's email.
Okay, then what is it? That's the one I found in this forum where it had been posted a month ago or so.
That's not Charlie's email.
Okay, then what is it? That's the one I found in this forum where it had been posted a month ago or so.
Okay, then what is it? That's the one I found in this forum where it had been posted a month ago or so.
That email is basically customer support, but it seems people get better results with it.