Ciel-2 Signal Monitoring

Smith P.

On Vacation
Original poster
Oct 4, 2003
8,907
2
Bay Area, CA
Lets start today from fresh page. :)


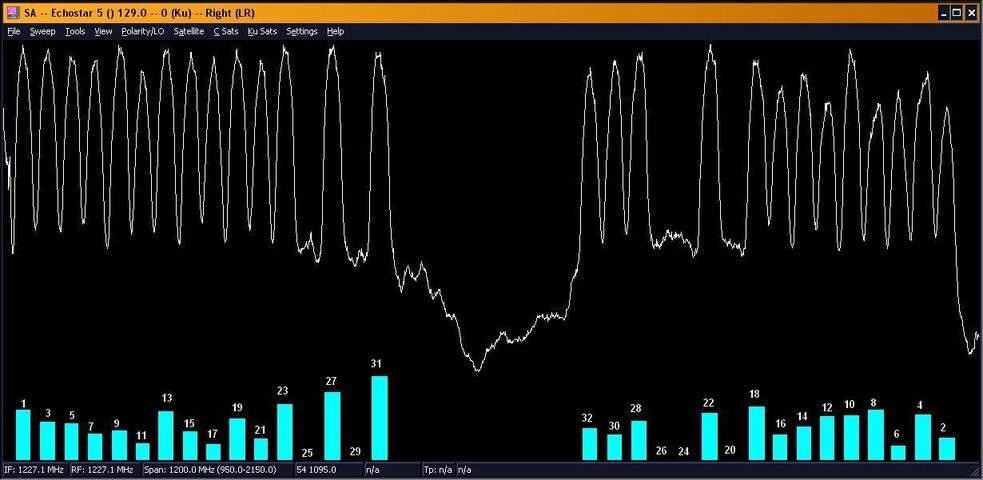
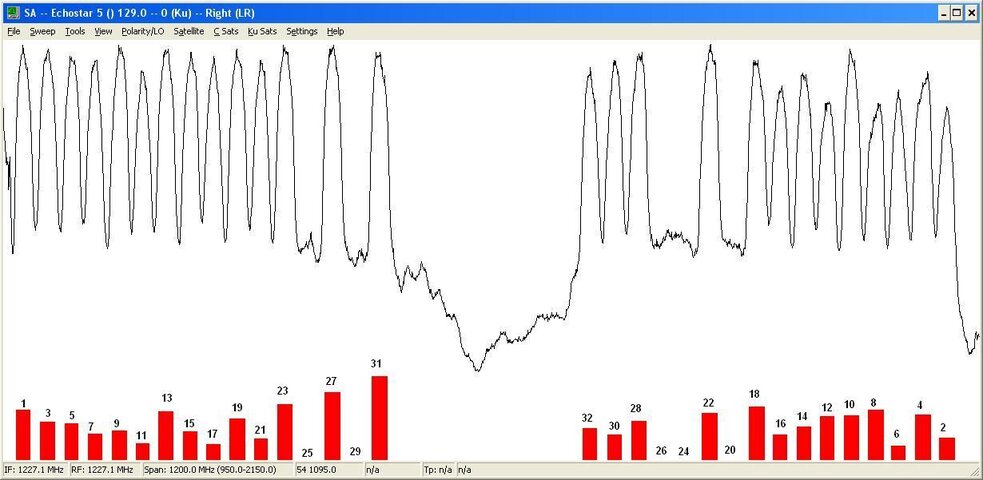
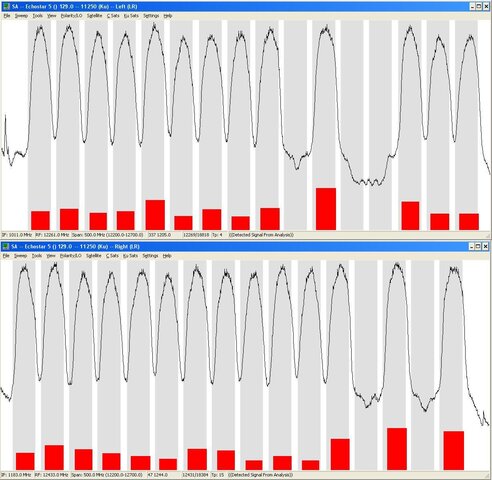
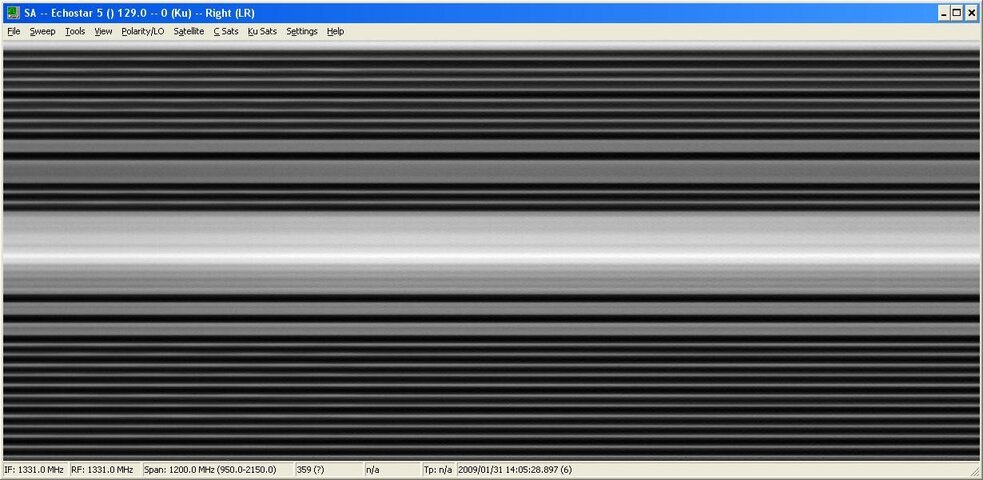
Here is spectrum of the sat at 129W. Using BLSA, 1m dish, Invacom QPH-031 LNBF, Bay Area.

Some tpn levels: tp5 (R) - 38...58%|80%; tp16 (L) - 56...73%|93%. [Q|S]
 

Attachments

  • 129L_R.JPG
    129L_R.JPG
    137.2 KB · Views: 465
Last edited:
Is someone had old spectrums of the 129W ?
My last SS numbers from end of 2008 shows eight empty tpns: 14, 15, 20, 24, 25, 26, 28, 29, but today only five missing: 18, 22, 24, 25, 29.
 
Spectrum of 129W taken from D1000+ today with both polarities - even tpn's freqs are inverted.
 

Attachments

  • 129W_D1000.JPG
    129W_D1000.JPG
    68.9 KB · Views: 260
Spectrum of 129W taken from D1000+ today with both polarities - even tpn's freqs are inverted.

The problem is that E5 is oscillating in more than one plane. If you watch it for a while everyother even or odd transponder will change signal faster than the adjoining even or odd transponder. The fluctuating signal strength and the fluctuation between transponders makes the data very difficult to use. About all I see so far is that the dead transponders continue to be dead.
 
Just for compare apples ie dishes: D1000+ tp16 show 26...29%|95% levels using same TH1020 PCI card.
While TH1020 at 31...33% SQ, a 622 show steady SS=30 for the tp16.
 
Last edited:
There is skyscan for 9:11pm - 8:23am PDT last night. Acquisition rate was 2 times per minute.
Bottom line show TT&C activity. Post #4 shows corresponding tpns - tpn1 at bottom, tpn2 at top of skyscan picture.
Next run will be for 24 hours.
 

Attachments

  • 129W_11hrs.jpg
    129W_11hrs.jpg
    168.3 KB · Views: 254
Damn, Smith you got your own private thread. Ops, excuse me for posting. Moderator, please delete my comment.
 
New skyscan picture of 129W taken from 8:40am 2/1 to 8am 2/2; you can see one short bleep on tp1 happened exactly midnight.
 

Attachments

  • 129W_24hrs_2-1-9.jpg
    129W_24hrs_2-1-9.jpg
    192.2 KB · Views: 331
New skyscan picture of 129W taken from 8:40am 2/1 to 8am 2/2; you can see one short bleep on tp1 happened exactly midnight.

I see a little fly spec. But, Smith you got to explain it a little. I like this stuff and totally do not understand what I am looking at.
 
You should be excited everytime Smitty puts up thumbnail. Now you better stay on topic or you will get slapped by him.
 
I see a little fly spec. But, Smith you got to explain it a little. I like this stuff and totally do not understand what I am looking at.
Well, it's pretty easy; you could see same on Fred's site here.

X ax is a time, Y - freq, bottom low freq, top - high.
Now imagine a picture in post#4 had inverted colors, so high signal level will be bright white, no signal - black. Then rotate the picture counterclockwise for 90° . Making samples 1 or 2 times per minute and combine 15000 of them into one picture. Voilà - you see the skyscan.
[Anyone who interesting in BLSA could find them quickly - use my PM.]

Added a picture from post#4 with inverted colors. ;)
 

Attachments

  • 129W_D1000inv.JPG
    129W_D1000inv.JPG
    68.9 KB · Views: 189
Last edited:

Users Who Are Viewing This Thread (Total: 0, Members: 0, Guests: 0)

Who Read This Thread (Total Members: 1)