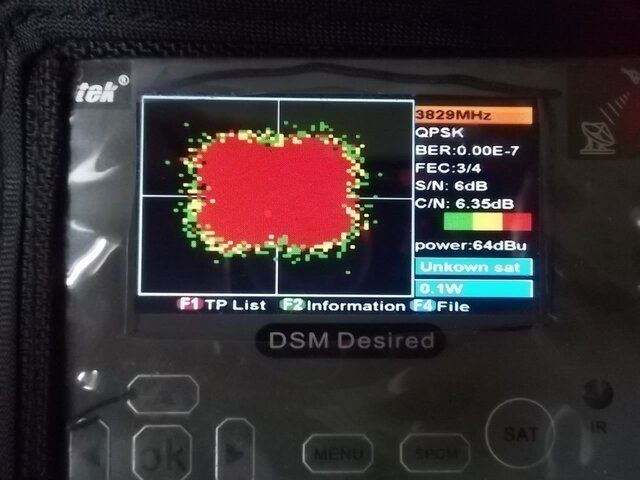
Hello all. Need some help interpreting what the Constellation option reveals. Attached is a pic taken this morning on my 8Dtek Desired. Not much in the op manual on what to look for and what this all means.
Pic is TP for Conoce Mexico, 113W C band, using a 1M Channel Master dish with DMSI BSC621-2DC/Ku combo LNB. 40% SQ.
First off, how long do you let the Constellation option run? This was run about about 5 minutes; that long enough? As time went by the BER stabilized. For other TPs the BER was bouncing around and was not stable.
What should the pattern look like in the four quadrants normally? What would a "bad" signal look like vs. a "good" signal? Kind of reminds me of the artists who used pointilism hi hi.
On the right, what does that info mean? OK, I get it about the TP frequency, FEC (forward error correction), S/N (signal to noise ratio), QPSK is the modulation type. Not sure what C/N is, or that green-yellow-red color bar is.
Right bottom shows "Power" as 64dBu, - guess that means that the signal strength is 64 microwatts? What concerns me is that even on a "dead' transponder this value shows up as 63 dBu, which makes me wonder if this calculation is worthless on this meter.
Could this Constellation option be used in the field while optimizing a dish? I would think so. For example, optimizing for the best dBu... Maybe that is overkill. Need the advice of experts in the field.
I am assuming that all the calculations in this option have been tested by the manufacturer's engineers and found to be accurate.
Thanks for the help.