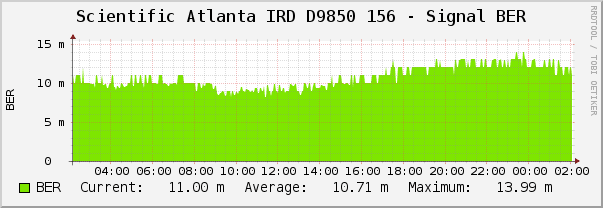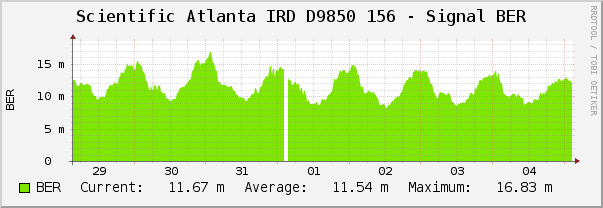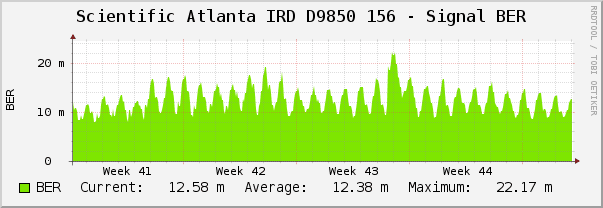
Attached are graph images created by cacti (web php software suite that creates graphs of polled SNMP data over time) of my Sci Atl D9850 commercial IRD tuned to TP2 of AMC 1. They are of BER. It's interesting how it changes over time. The peaks are around midnight and the troughs are around 10AM. The dish is my Fortec 6' and the LNB is a Norsat 8515. I use the IRD for DW-TV and Deutsche Welle Radio. Attached are images from a 24 hour period, weekly, and monthly. I'm not exactly sure why the BER is highest around midnight and lowest around 10AM.
Jonathan
Jonathan